
-
Apple shares gained ground Wednesday after losing more than a fifth of their value over the previous four sessions amid concerns about the impact of a trade war between the U.S. and China.
-
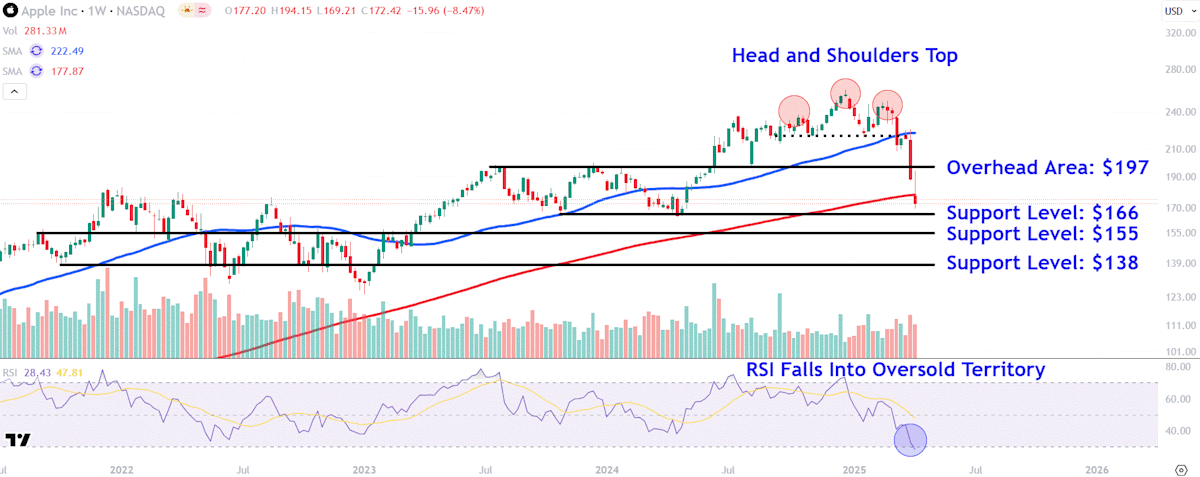
The stock’s dramatic intraday reversal on Tuesday saw the price close decisively below the closely watched 200-week moving average.
-
Investors should eye major support levels on Apple’s chart around $166, $155, and $138, while also monitoring a key overhead area near $197.
Apple (AAPL) shares moved higher Wednesday after losing more than a fifth of their value over the previous four sessions amid concerns about the impact of a trade war between the U.S. and China.
The recent decline, which saw Apple briefly lose its title as the world’s most valuable company, took place as investors braced for the Trump administration’s sweeping tariffs to take effect, notably a 104% levy on imports from China, where an estimated 90% of the company’s products are assembled.
Apple shares were up more than 3% at around $178 in midday trading, making it one of the top gainers in the S&P 500.
Below, we take a closer look at Apple’s weekly chart and use technical analysis to identify major price levels worth watching out for.
Selling in Apple shares has accelerated after the price broke down below the neckline of a head and shoulders pattern last month. More recently, the stock’s dramatic intraday reversal during Tuesday’s trading session saw the price close decisively below the closely watched 200-week moving average.
While the relative strength index (RSI) confirms bearish price momentum, the indicator has slipped into oversold territory, increasing the likelihood of investors seeking short-term bounce opportunities.
Let’s identify three major support levels on Apple’s chart that investors may be eyeing and also point out a key overhead area worth monitoring.
The first lower level to watch sits around $166, an area where the shares could attract buying interest near two prominent swing lows that formed on the chart in October 2023 and April last year.
The bulls’ failure to defend this level could see Apple shares fall to $155. This location may provide support near a trendline that connects a range of comparable trading activity on the chart between September 2021 and March 2023.
A more significant drop brings lower support at the $138 level into play. Investors could seek long-term buying opportunities in this region near two key troughs on the chart that preceded the notable January 2023 swing low.