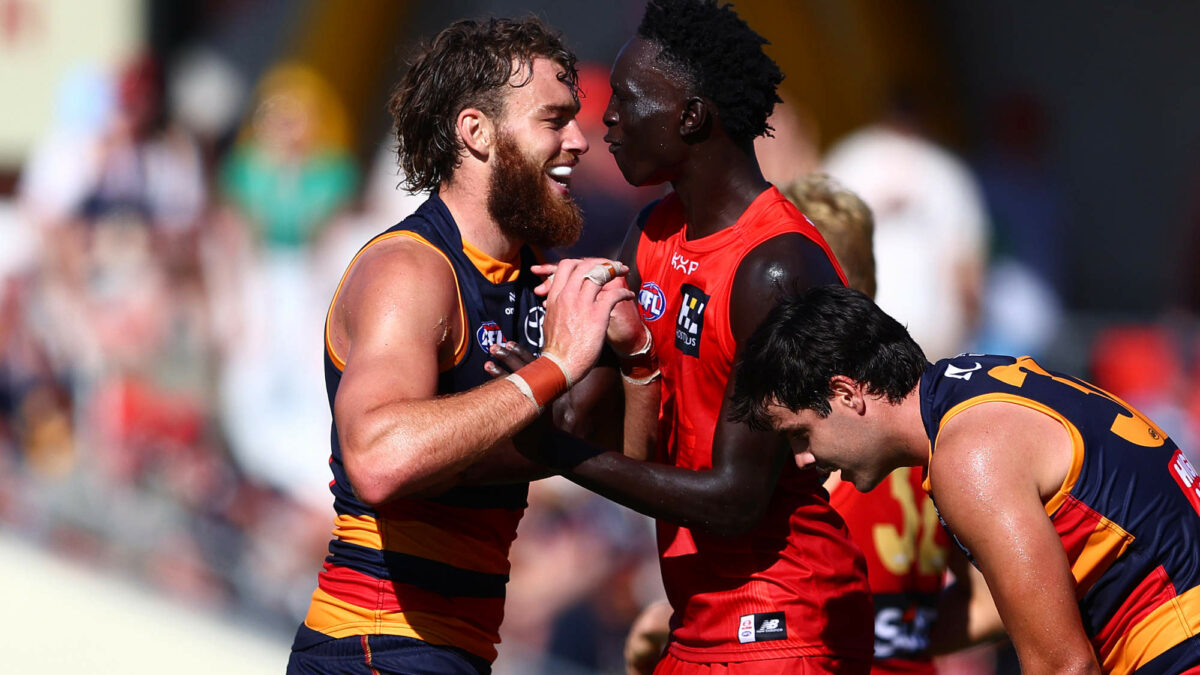
As the 2025 AFL season hits its stride, questions around fixture fairness are beginning to bubble. The Gold Coast Suns won their first five games of the 2025 season, becoming the last undefeated club remaining. However, questions arose surrounding the teams they played.
Using a data-driven approach, we’ve analysed each club’s first six rounds by tallying the total number of wins recorded by their opponents. The result? A clearer picture of which teams have had a cruisey run — and which have been battle-tested early. In their five matches so far, they have already played all four of the current bottom-four teams, with 14th Sydney to come this weekend.
So, how much does the Suns’ record breaking start actually mean?
By linking every club’s fixture to the win records of their opponents, we created a ranking of fixture difficulty. The fewer wins your opponents have, the “easier” your fixture is considered. Fans and pundits alike may be surprised by some of the early results, with a few top-ranked teams benefitting from softer opposition while some struggling clubs may be victims of brutal early draws.
Here are the results.
– Total Opponents Wins: the sum of their opponents wins
– Average Opponents Wins: the sum of their opponents wins divided by the number of games played
– Adjusted Opponents Wins: the sum of their opponents wins – minus their own losses (taking out their own losses from opponents wins)
– Adjusted Average Opponents Wins: adjusted opponents wins divided by the number of games played
Team | TOTAL Opponents Wins | AVERAGE Opponents Wins | ADJUSTED Opponents Wins | ADJUSTED AVERAGE Opponents Wins
1. Geelong | 20.0 | 3.3 | 18.0 | 3.0
1. Adelaide | 20.0 | 3.3 | 18.0 | 3.0
3. Collingwood | 19.0 | 3.2 | 18.0 | 3.0
4. Sydney | 21.0 | 3.5 | 17.0 | 2.8
5. St Kilda | 20.0 | 3.3 | 17.0 | 2.8
6. Richmond | 20.5 | 3.4 | 16.5 | 2.8
7. Port Adelaide | 19.5 | 3.3 | 16.5 | 2.8
8. Hawthorn | 18.5 | 3.1 | 16.5 | 2.8
9. West Coast | 22.0 | 3.7 | 16.0 | 2.7
10. Western Bulldogs | 19.0 | 3.2 | 16.0 | 2.7
11. Melbourne | 20.0 | 3.3 | 15.0 | 2.5
12. GWS Giants | 17.0 | 2.8 | 15.0 | 2.5
13. Brisbane | 16.0 | 2.7 | 15.0 | 2.5
14. North Melbourne | 16.5 | 2.8 | 11.5 | 1.9
15. Carlton | 15.0 | 2.5 | 11.0 | 1.8
16. Essendon | 12.0 | 2.0 | 9.5 | 1.6
17. Fremantle | 12.0 | 2.0 | 9.0 | 1.5
18. Gold Coast | 8.0 | 1.3 | 6.5 | 1.1
What do these results mean?
The fixture difficulty results reveal that Geelong, Adelaide, and Collingwood have faced the toughest starts to the 2025 AFL season, each with an adjusted opponent win average of 3.0. This means they’ve consistently played strong, in-form teams.
Interestingly enough, these three teams have all had decent starts to the season, with Adelaide and Geelong winning four games from six, and Collingwood sitting top of the ladder with five wins. Big seasons could be in store for these teams.
In contrast, teams like Gold Coast, Fremantle, and Essendon have had much easier draws, facing weaker oppositions with adjusted averages below 1.6. Gold Coast, in particular, sit third on the AFL ladder, but have many concerns with how they will perform when they face tougher teams, especially after their loss to Richmond on Saturday night at Marvel Stadium.
As the season unfolds and the draw evens out, we’ll get a clearer sense of which teams are genuine premiership contenders — and which have simply made the most of a favourable early run. Fixture difficulty doesn’t tell the whole story, but it offers critical context in separating the real threats from the early-season pretenders.


