-
Apple shares fell sharply to close out last week after President Trump threatened to impose hefty tariffs on the company if it doesn’t manufacture iPhones in the U.S.
-
The stock has closed lower for eight consecutive sessions and has lost 22% of its value since the start of the year, lagging the performance of its Magnificent Seven peers.
-
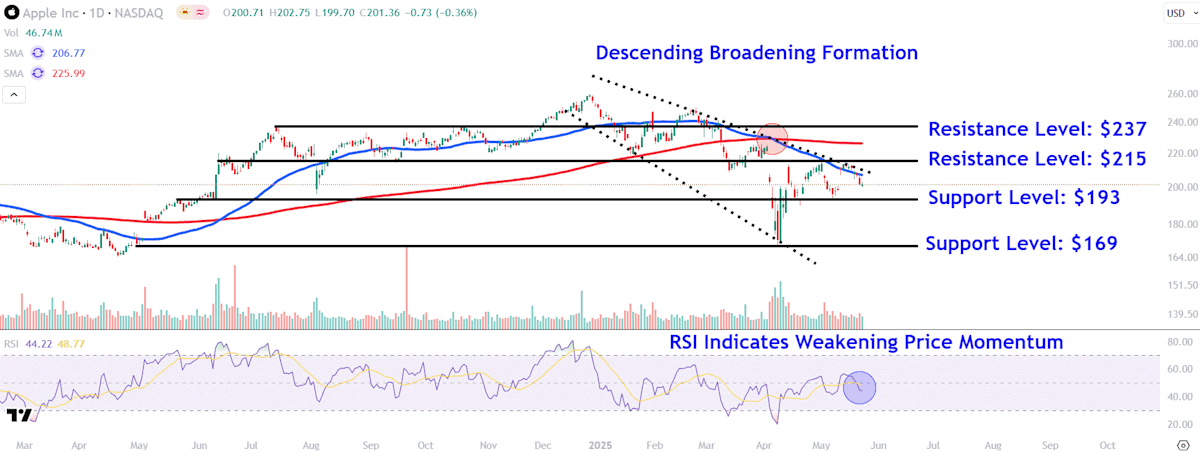
The price recently ran into selling pressure near the upper trendline of a descending broadening formation and the 50-day moving average.
-
Investors should watch major support levels on Apple’s chart around $193 and $169, while also monitoring crucial resistance levels near $215 and $237.
Apple (AAPL) shares will be in the spotlight at the start of the holiday-shortened trading week after falling sharply Friday when President Donald Trump threatened to impose hefty tariffs on the company if it doesn’t manufacture iPhones in the U.S.
In a Friday-morning post on Truth Social, Trump said he had told Apple CEO Tim Cook that iPhones sold in the US must be built in the U.S. “If that is not the case, a Tariff of at least 25% must be paid by Apple to the U.S.,” the president said.
Trump’s comments were his latest push to ensure that Apple doesn’t expand iPhone production in India as it shifts away from manufacturing in China, which faces among the highest import tariffs of U.S. trading partners. Apple’s imports into the U.S. have so far escaped being hit since the Trump administration exempted smartphones, computers and some other consumer electronic devices from “reciprocal” tariffs imposed in early April.
Apple shares dropped 3% on Friday to around $195, losing ground for the eighth consecutive session. The stock has lost 22% of its value since the start of 2025, significantly lagging the performance of its Magnificent Seven peers, as sentiment toward the company has soured due to its significant exposure to tariffs
Below, we take a closer look at Apple’s chart and use technical analysis identify major price levels worth watching out for.
Since setting their record high in late December, Apple shares have trended lower within a descending broadening formation, with the price tagging the pattern’s upper and lower trendline on several occasions since that time.
More recently, the stock ran into selling pressure near the pattern’s upper trendline and 50-day moving average, which has coincided with the relative strength index falling below its neutral threshold to signal weakening price momentum.
It’s also worth pointing out that the 50-day MA crossed below the 200-day MA in early April to form a “death cross,” a chart signal that indicates further declines.


